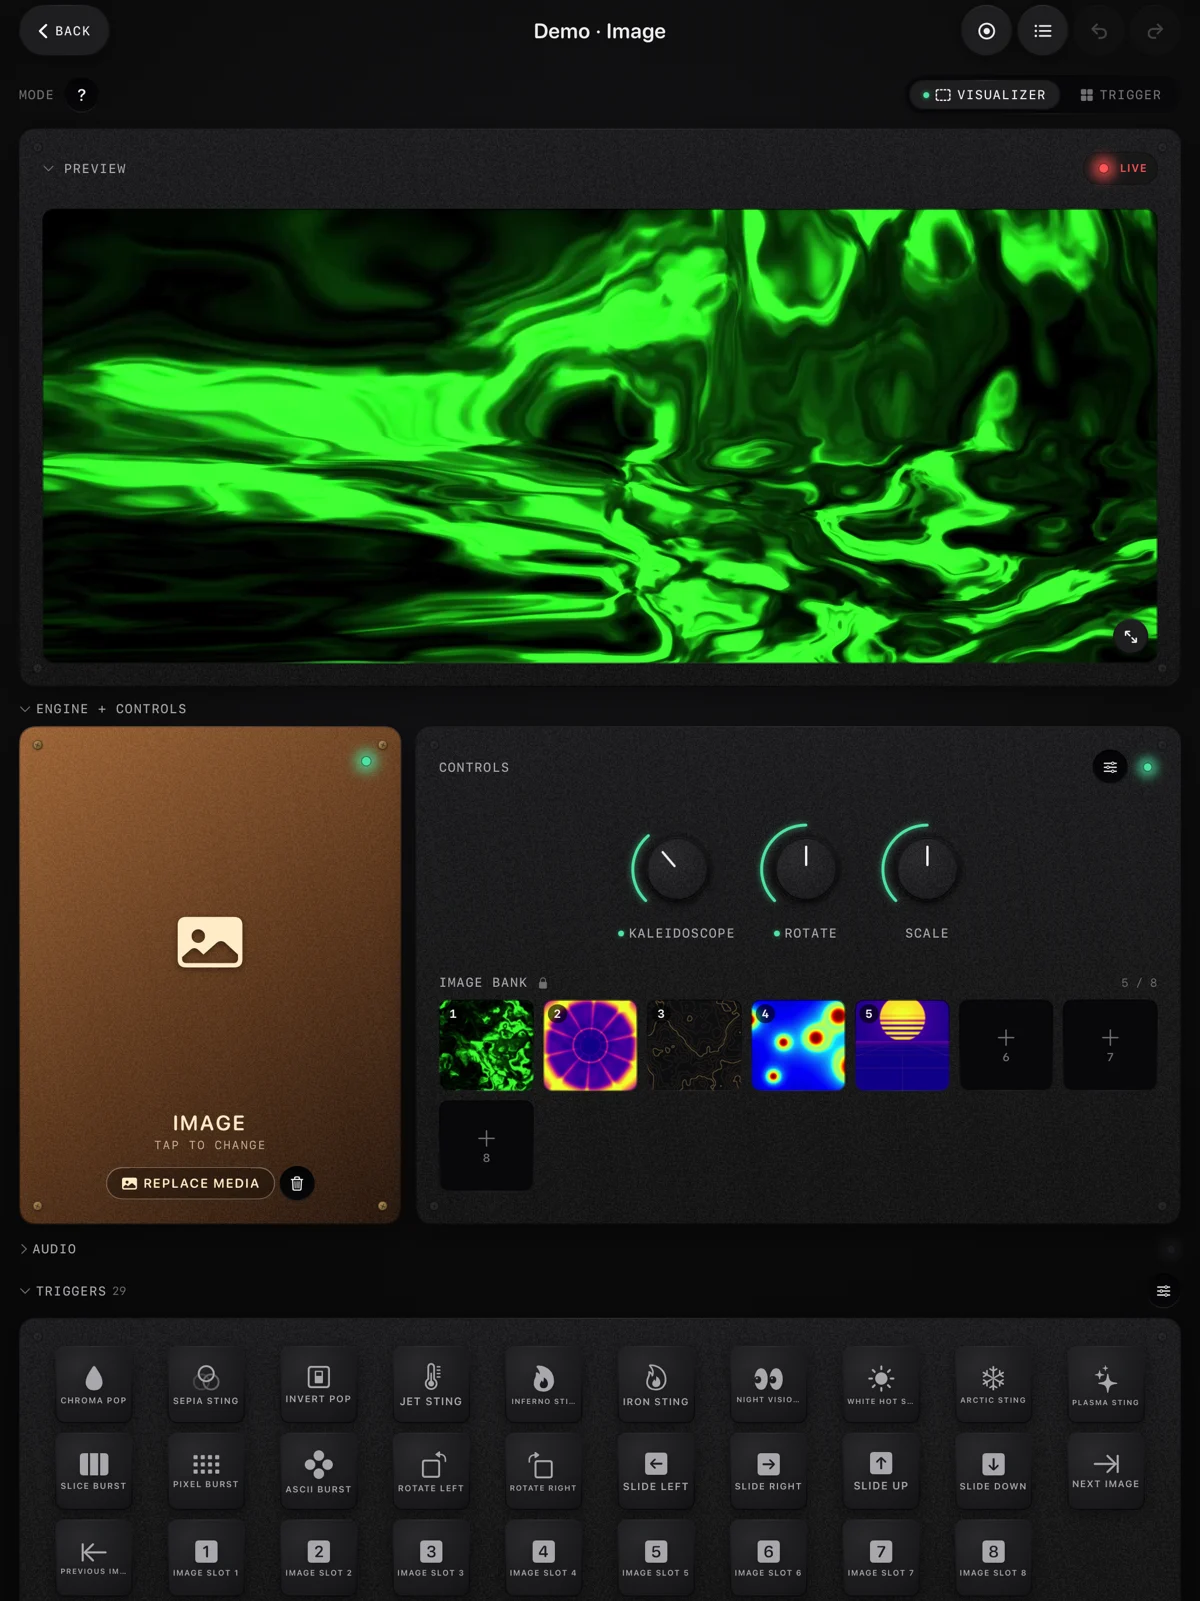
Visualizer Mode routes incoming audio directly to visual output parameters, rendering continuous, ambient motion that reacts to the precise frequency bands of your sound source. It eliminates complex timeline programming, relying instead on real-time acoustic analysis to trigger visual changes, map volume to image scale, and translate bass transients into rapid visual displacement.
The Mechanics of Visualizer Mode
Visualizer Mode processes continuous audio signals to generate fluid, reactive visual output. The system listens to the chosen audio input, analyzes the frequency spectrum, and translates those acoustic measurements into numerical control signals.
These signals map directly to visual parameters such as scale, rotation, colour shifting, and image opacity. The architecture ensures that your visuals breathe and pulse in exact synchrony with the sound in the room.
The core advantage of this mode is the absolute absence of timeline constraints. You do not place keyframes on a track.
You do not sequence events. The application functions as an acoustic mirror.
When silence falls, the visual output rests at its baseline parameters. When a kick drum hits, the bass frequencies exceed the defined threshold, triggering an immediate parameter spike.
When a sustained synth note rings out, the corresponding mid or high frequency band keeps the mapped parameter elevated until the note decays. The signal path begins at your chosen audio input.
The application splits this incoming signal into three distinct frequency bands: bass, mid, and high. Each band generates a separate data stream.
You assign these data streams to specific visual controls. You can map the bass stream to image scale, forcing the picture to expand on every kick.
You can map the high stream to rotation, spinning the asset whenever the hi-hat hits. The application recalculates these values every frame, ensuring that the visual output matches the audio input without perceptible delay.
The system handles both single source playback and live microphone input. When processing local files, the engine analyzes the waveform ahead of the playhead to guarantee precise synchronization.
When processing live audio through a microphone or sound card, the engine relies on low latency buffers to minimize the gap between the acoustic event and the visual reaction. This flexibility allows you to deploy Visualizer Mode in closed environments with pre-recorded tracks or in live spaces with bands, DJs, and ambient soundscapes.
Visualizer Mode operates entirely in real-time. The application reads the audio, calculates the visual math, and draws the frame.
There is no pre-rendering. Every performance generates unique visual output because the exact acoustic conditions of the room dictate the control signals.
You set the rules, define the boundaries, and allow the audio to drive the engine.
Hardware Configurations and Signal Routing
Deploying Visualizer Mode effectively requires precise hardware choices and deliberate signal routing. The application runs natively on iPhone, iPad, and Mac hardware.
Each platform presents specific advantages depending on your physical setup, mobility requirements, and output destinations. The iPhone offers maximum mobility.
It fits into small spaces, mounts easily to microphone stands, and relies on the internal microphone for immediate environmental audio capture. You connect the iPhone to an external display using a USB-C to HDMI adapter or a Lightning to HDMI adapter.
This setup suits guerrilla performances, small house parties, and temporary installations where space is severely restricted. The internal microphone functions adequately in controlled environments, but extreme volume levels in club settings will overload the capsule and cause signal clipping, resulting in erratic visual behavior.
The iPad provides a significantly larger control surface and superior thermal management. The physical dimensions allow for more accurate parameter adjustments during a live set.
You can mount the iPad on a dedicated stand beside your DJ gear or mixing console. The USB-C port on modern iPad models supports direct connection to class-compliant audio interfaces.
This routing eliminates the limitations of the internal microphone. You route a clean auxiliary mix from the primary sound desk directly into the audio interface, providing the application with an isolated, high quality signal.
This method prevents crowd noise and room reflections from interfering with the visual triggers. The Mac hardware provides the highest processing ceiling.
Apple Silicon processors handle heavy video loads and multiple high resolution outputs simultaneously. The Mac allows for complex audio routing using software aggregators or advanced digital mixing consoles connected via USB or Thunderbolt.
You can route multiple discrete audio channels into the Mac, isolating the kick drum, bassline, and vocals on separate inputs. While ImmerGround currently analyzes a single stereo mix in Visualizer Mode, providing a surgically equalized sub-mix from the front of house console guarantees the most precise visual response.
The Mac also supports multiple external displays through dedicated docking stations or display matrices. Routing external audio into the application demands attention to gain staging at the hardware level.
- Direct Interface Connection Connect a class-compliant USB audio interface to your host device. Route an auxiliary send from the main mixer into the interface inputs. Set the interface gain to peak at -12 dB to leave sufficient headroom for unexpected volume spikes.
- Digital Mixer USB Routing Connect the host device directly to a digital mixer via USB. Assign the master bus or a dedicated visual mix bus to the USB output channels. This method provides the cleanest signal path and zero analogue degradation.
- Internal Microphone Capture Place the host device in an optimal location relative to the sound source. Avoid placing the device directly in front of subwoofers, as the physical air pressure will distort the microphone capsule. Aim for a central location that captures a balanced representation of the room sound.
| Hardware Platform | Primary Advantage | Audio Input Method | Output Capability | Thermal Endurance |
|---|---|---|---|---|
| iPhone | Extreme mobility | Internal Mic / Lightning Adapter | Single HDMI via adapter | Low to Medium |
| iPad | Touch control surface | Internal Mic / USB-C Audio Interface | Single HDMI / DisplayPort | High |
| Mac | Processing ceiling | USB Interface / Digital Mixer | Multiple Displays | Maximum |
Audio Signal Calibration and Threshold Tuning
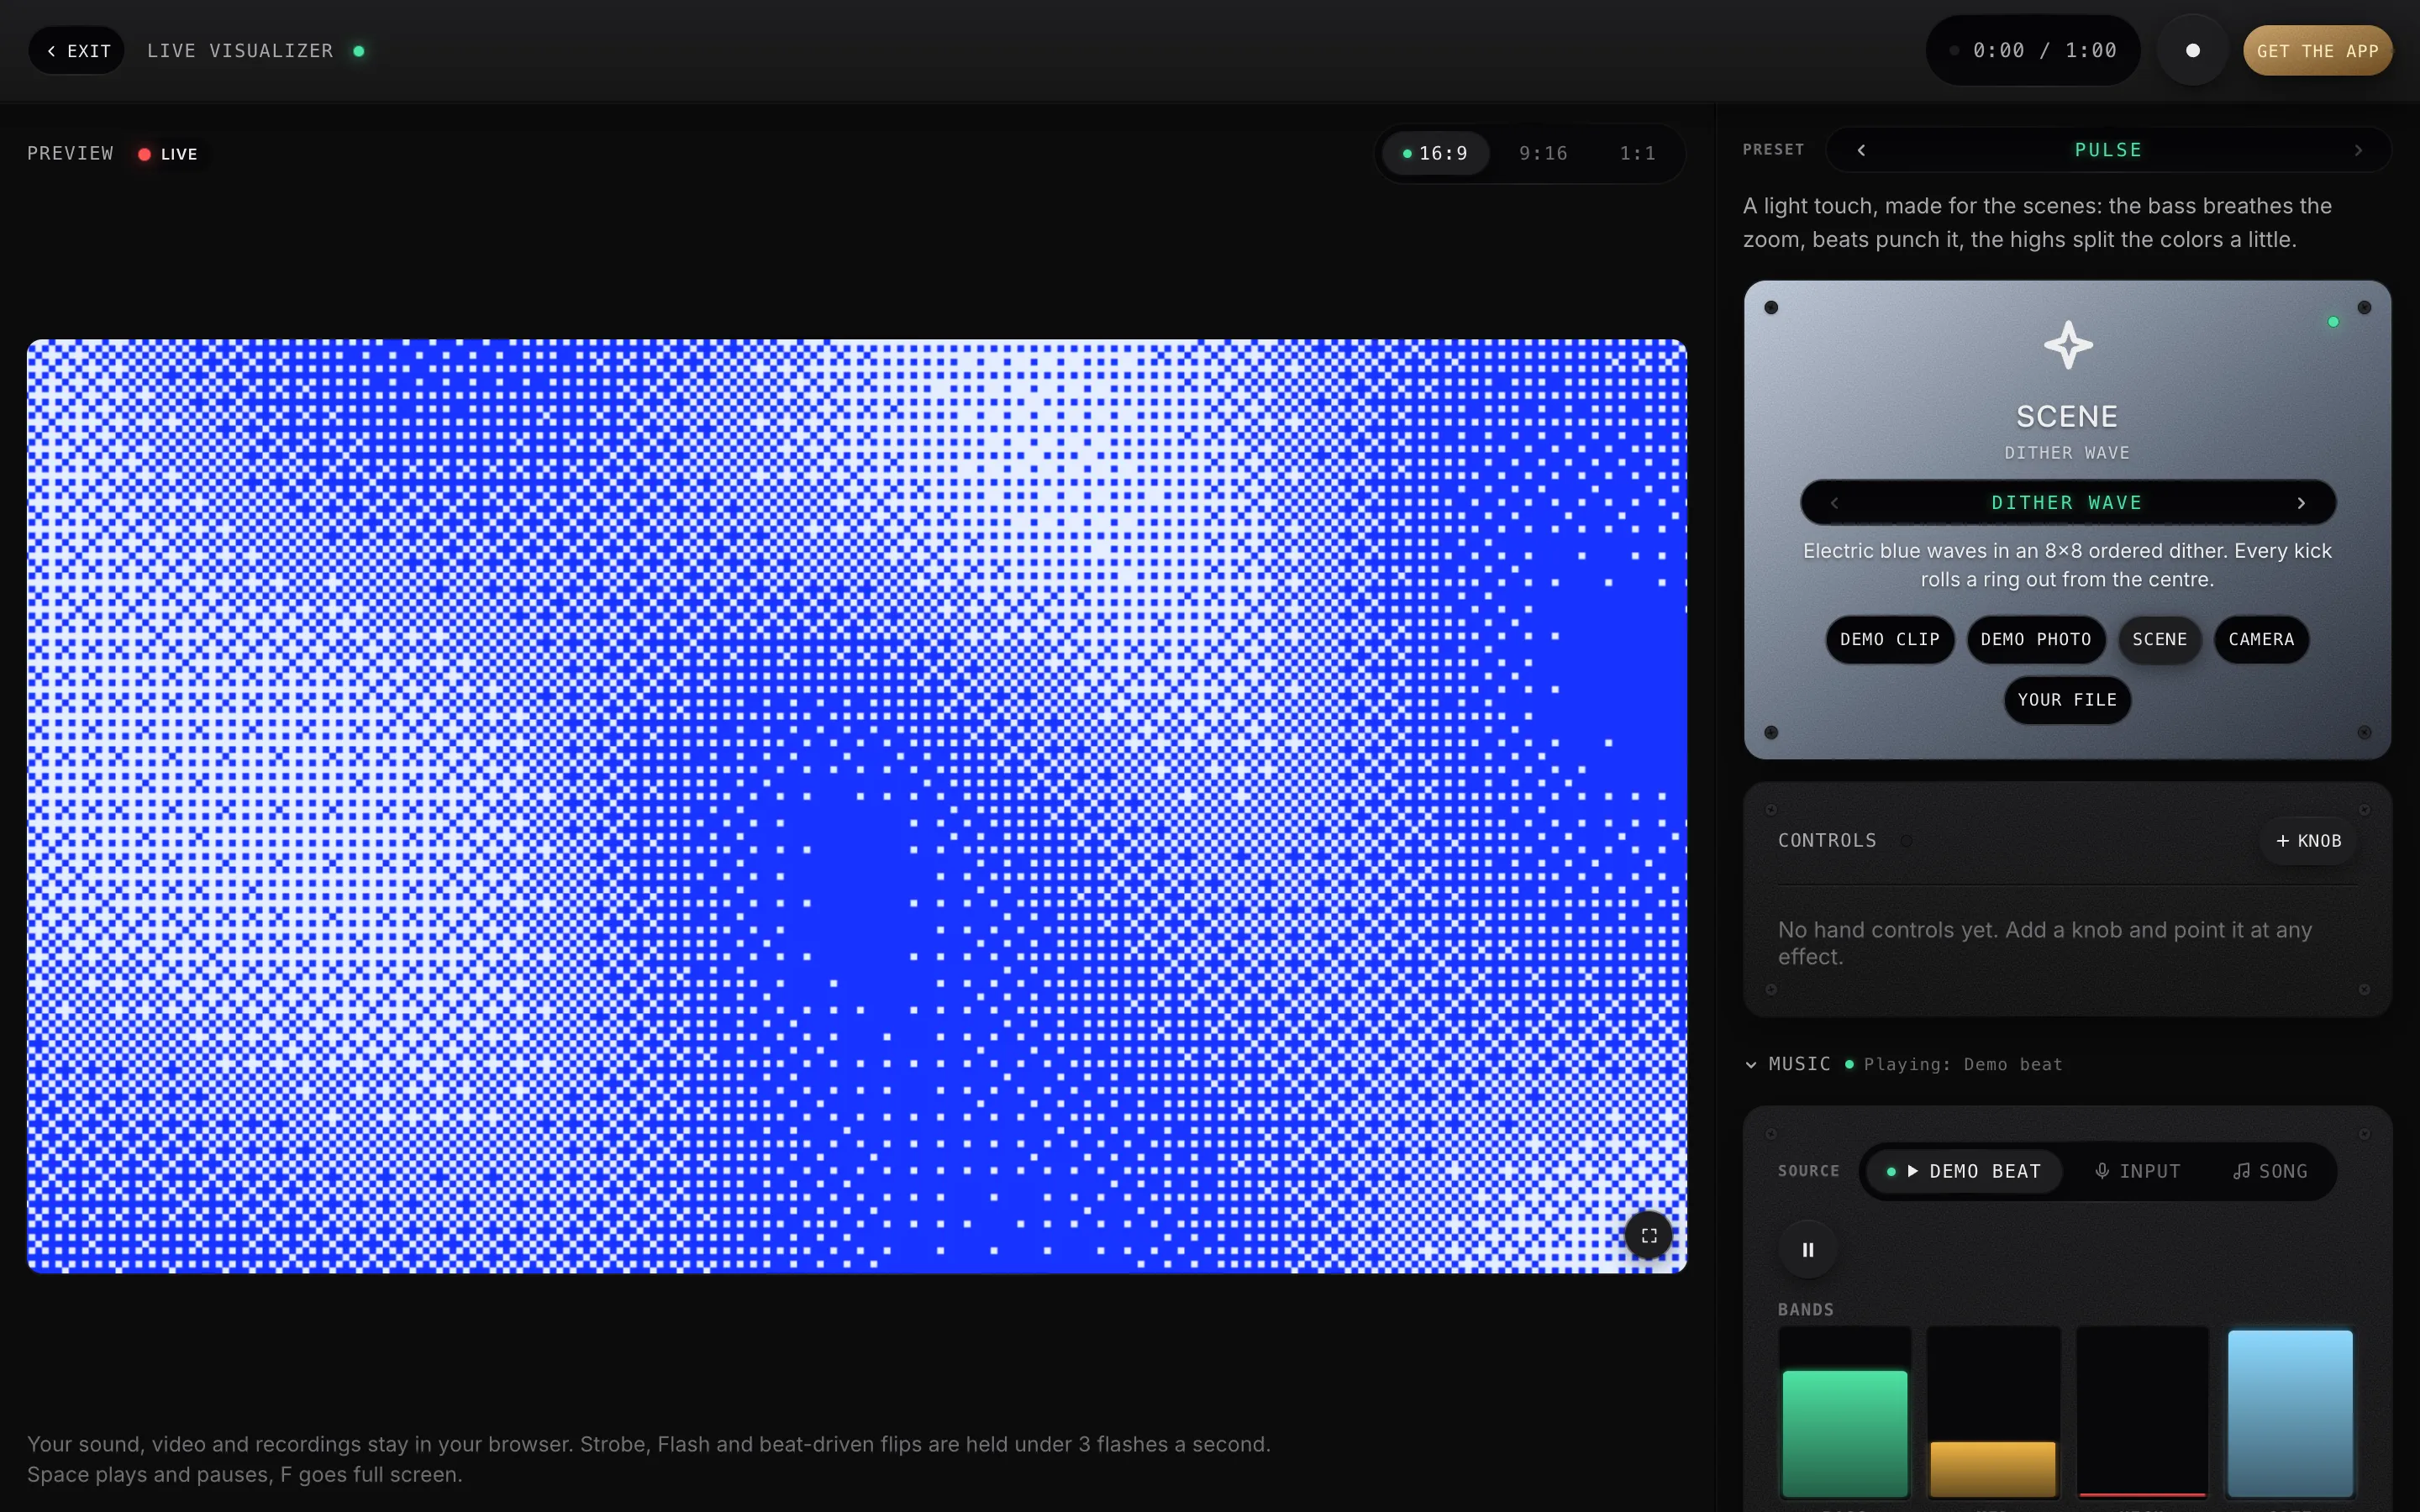
The visual output remains chaotic and unpredictable without rigorous audio calibration. Visualizer Mode interprets audio signals based on your predefined thresholds and sensitivity settings.
Proper calibration ensures that the visuals react to musical events rather than background noise. The application divides the incoming audio into three distinct frequency bands.
The bass band captures low frequency energy, typically kick drums and sub-bass lines. The mid band captures the bulk of musical information, including vocals, synthesizers, and guitars.
The high band captures high frequency transients, such as cymbals, hi-hats, and sharp electronic clicks. You control the sensitivity and gain for each band independently.
Begin the calibration process by setting the master input gain. The incoming signal must be strong enough to trigger the visual parameters, but not so loud that it remains constantly above the maximum threshold.
Observe the input meters within the application. Adjust the hardware gain on your audio interface or the software gain within the app until the loudest musical peaks hit the top of the meter without sustaining there.
Sustained clipping results in static, unmoving visuals because the control signal remains locked at its maximum value. The noise gate is the most critical tool for achieving clean visual reactions.
The gate prevents low level background noise from triggering visual changes. In a quiet studio environment, you can set the noise gate very low, around -60 dB.
In a noisy club environment, ambient crowd noise and room rumble will constantly trigger the visuals if the gate is too low. In these settings, raise the noise gate to -54 dB or higher.
The goal is to ensure that only the direct sound from the PA system breaches the gate threshold. When the music stops, the visuals must immediately return to their resting state.
After setting the master gain and the noise gate, proceed to tune the individual frequency bands. This process determines how the visuals react to specific musical elements.
- Bass Band Tuning The bass band usually drives structural visual changes, such as overall image scale or primary rotation. You want the bass reaction to be decisive and immediate. Set the bass threshold high enough that only the kick drum triggers it. If the threshold is too low, sustained bass notes will keep the visual parameter locked at maximum.
- Mid Band Tuning The mid band contains complex, overlapping information. Mapping the mid band to parameters like opacity or secondary color shifts creates a continuous, breathing effect. Adjust the mid sensitivity so the visual parameter undulates smoothly with the vocal or lead synth melody.
- High Band Tuning The high band consists of rapid, short transients. Map the high band to fast, erratic visual parameters like position jitter or rapid rotation. Keep the high band sensitivity high to capture the subtle nuances of the hi-hat patterns.
Sensitivity scaling dictates the mapping curve between the audio volume and the visual parameter. A linear curve translates the volume directly to the parameter value.
A logarithmic curve requires significantly more volume to reach the maximum parameter value, resulting in a more subtle visual response that only peaks during the loudest musical climaxes. Adjusting the sensitivity scaling for each band allows you to fine-tune the exact feel of the visual performance.
Engine Selection and Visual Dynamics
Visualizer Mode operates through distinct rendering engines. The engine you select dictates the fundamental nature of the visual output.
The Video engine and the Image engine process assets differently and offer unique parameters for audio mapping. The Image engine processes static photographs, graphics, and illustrations.
When driven by audio, the Image engine manipulates the geometry, scale, rotation, and color of the static asset. This engine is highly efficient and consumes minimal processing power, making it ideal for mobile devices running on battery power or older hardware.
You load an image bank containing multiple static assets. You can map a frequency band to trigger an image swap, advancing to the next picture in the bank every time the bass hits a specific threshold.
This technique creates a rapid, strobe-like sequence of images synchronized to the rhythm. Mapping audio to the Image engine parameters creates the illusion of motion from static assets.
Routing the bass band to the scale parameter causes the image to pump forward on every kick drum. Routing the high band to the rotation parameter causes the image to snap to a new angle on every snare hit.
By combining these mappings, you shape a rigid photograph into a dynamic, pulsating visual element. The Image engine excels at creating stark, graphic visual performances that rely on rapid transitions and extreme geometric manipulation.
The Video engine processes moving footage, animated loops, and pre-rendered motion graphics. This engine demands significantly more processing power.
The Video engine maps audio signals to the playback speed, opacity, and color grading of the video file. You can load a folder of ambient video loops and map the mid band to the overall opacity, causing the video to fade in and out based on the volume of the synthesizer chords.
The most potent technique with the Video engine involves mapping audio transients to video playback speed. By routing the bass band to the speed parameter, the video plays at normal speed during quiet sections, but accelerates rapidly when the kick drum hits.
This creates a deeply synchronized, kinetic visual experience where the footage itself appears to react to the physical force of the music. You can also map audio to trigger random clip selection from a loaded directory, ensuring that the visual narrative constantly shifts based on the musical structure.
| Engine Type | Asset Type | Primary Audio Mappings | Processing Load | Ideal Scenario |
|---|---|---|---|---|
| Image Engine | Photos, Graphics, Stills | Scale, Rotation, Image Swap | Low | Graphic bursts, logo animation |
| Video Engine | MP4, MOV, Loops | Speed, Opacity, Clip Selection | High | Ambient textures, kinetic footage |
Balancing the visual dynamics requires careful consideration of the resting state. The resting state is the visual condition when no audio breaches the thresholds.
If you map scale to the bass band, you must define the minimum scale. If the minimum scale is too small, the screen goes entirely black between beats.
Define a baseline scale of fifty percent, allowing the audio to drive the scale up to one hundred percent. This ensures a continuous visual presence on screen, with the audio adding dynamic peaks rather than acting as a simple on/off switch.
The intricacies of audio-reactive visual generation demand a deep understanding of digital signal processing and real-time graphics rendering pipelines. When you feed an audio signal into the application, the software executes a Fast Fourier shape (FFT) on the incoming audio buffer.
This mathematical operation converts the time-domain waveform into a frequency-domain spectrum. The application then groups these discrete frequency bins into the three broad bands: bass, mid, and high.
The speed at which this FFT calculation occurs directly impacts the latency of the visual output. A smaller audio buffer size forces the application to calculate the FFT more frequently, resulting in lower latency and a tighter visual response to sudden transients.
However, smaller buffer sizes increase the CPU load significantly. Finding the optimal buffer size requires balancing the need for immediate visual reaction against the processing limits of your specific hardware device.
The process of mapping frequency bands to visual parameters relies on numerical interpolation and smoothing algorithms. Raw FFT data is erratic and jagged.
If you mapped the raw data directly to a visual parameter like scale, the image would jitter violently and appear broken. The application applies mathematical smoothing filters to the control signals before they reach the graphics engine.
You can adjust the attack and release times of these filters. A short attack time causes the visual parameter to snap instantly to its new value when a loud sound occurs.
A long release time causes the parameter to slowly fade back to its resting state after the sound stops. Manipulating these envelope times is crucial for shaping the visual character of the performance.
A sharp attack and short release create a harsh, strobe-like effect suitable for aggressive techno or heavy metal. A slow attack and long release generate a fluid, ambient wash of color and motion ideal for drone music or cinematic soundscapes.
Visualizer Mode extends its utility beyond mere entertainment and enters the realm of practical technical analysis. Sound engineers and acousticians use audio-reactive graphics to visualize the frequency response of a room.
By routing a pink noise generator through the PA system and capturing the resulting audio with a measurement microphone, the operator can observe how the room colors the sound. If the low-frequency visual parameters remain constantly pinned while the high-frequency parameters barely move, the operator immediately knows the room has a severe bass buildup problem.
This immediate, visual feedback loop allows for rapid equalization adjustments on the main console. The application reframes abstract acoustic problems into clear, observable visual data.
The integration of complex visual setups into existing lighting rigs requires careful consideration of brightness and color space. Video projectors and LED walls output significantly more light than traditional stage wash lighting.
An overly bright, flashing visual output can easily overpower the entire lighting design, blinding the audience and distracting from the performers. You must calibrate the master opacity and color saturation of the visual output to sit comfortably within the overall production design.
Use the application's master dimming controls to limit the peak brightness of the video feed. Employ color palettes that complement the existing stage lighting rather than clashing with it.
If the lighting designer is running a predominantly blue and magenta color scheme, adjust the visual assets to exist within that same color space, ensuring a cohesive and unified aesthetic experience for the audience. The architecture of the rendering engine dictates how it handles multiple simultaneous visual events.
When a kick drum, a snare, and a vocal all hit simultaneously, the engine must process three separate audio triggers and calculate the resulting visual geometry changes within a single frame interval. The system prioritizes the heaviest geometric calculations first.
If you have mapped the bass band to a complex 3D rotation matrix and the high band to a simple opacity shift, the engine calculates the rotation before adjusting the opacity. Understanding this hierarchy helps you design mapping strategies that do not stall the rendering pipeline.
Avoid mapping multiple frequency bands to complex, processor-intensive parameters simultaneously. Distribute the visual load.
Map the bass to structural changes, the mid to color, and the high to subtle position shifts. This division of labor ensures the graphics processor can maintain a steady sixty frames per second even during chaotic, high-density musical passages.
The physical placement of the display surfaces heavily influences the perception of the audio-reactive visuals. Projecting onto a flat, white screen provides the clearest and most accurate representation of the digital image, but it remains a two-dimensional experience.
Projecting onto complex architectural geometry, such as the curved walls of a dome or the irregular surfaces of a brutalist concrete building, completely alters the visual impact. The geometry of the projection surface interacts with the motion generated by the audio triggers.
A simple expanding circle mapped to a kick drum becomes a complex, undulating wave when projected across a series of structural pillars. You must consider the physical canvas when designing your mapping strategy.
Assets that look impressive on a flat monitor may become illegible when projected onto irregular surfaces. Test your visual designs on the actual projection surfaces during the load-in phase, and adjust the scale and rotation parameters to maximize the impact on the specific physical geometry of the venue.
Network stability plays a critical role when deploying Visualizer Mode in distributed systems. While the application processes audio and renders graphics locally, you may need to control the host device remotely using network-based screen sharing or remote desktop protocols.
If the host Mac is located inside the projection booth, you will control it from the front of house mixing position using an iPad or a secondary laptop. This remote connection relies entirely on the local area network.
A weak or unstable Wi-Fi connection introduces severe latency into the control interface, making it impossible to adjust parameters in time with the music. Always deploy a dedicated, high-speed wireless router or use a hardwired ethernet connection to establish the remote control link.
Keep this network completely isolated from the venue's public Wi-Fi to prevent interference and ensure absolute control reliability during the performance.
Real-World Venue and Studio Scenarios
Visualizer Mode adapts to various physical environments, from massive club systems to intimate studio spaces. The specific implementation depends entirely on the acoustic conditions and the visual objectives of the space.
In an ambient DJ set or electronic music performance, the visual output must match the continuous, evolving nature of the music. The DJ routes a stereo feed from the mixer booth directly into the iPad running the application.
The iPad connects to the venue's projector via HDMI. The operator loads a bank of abstract, slow-moving video loops into the Video engine.
They map the bass band to video opacity, but apply a slow decay envelope to the parameter. This means the visual fades in quickly when the bass hits, but fades out slowly, creating a smooth, breathing effect that suits ambient music perfectly.
The mid band maps to subtle color shifts, ensuring that the visual texture changes as the harmonic content of the track evolves. Cocktail lounges and hospitality venues require a different approach.
The visual presence must be sophisticated, unobtrusive, and continuous. The establishment uses a Mac hidden behind the bar, connected to several wall-mounted screens.
The audio input relies on an ambient room microphone placed near the center of the space. The operator selects the Image engine and loads a bank of high-resolution architectural photographs and branding assets.
They map the overall volume to a very slow, continuous rotation and scale effect. The noise gate is set relatively high, ignoring the clinking of glasses and low conversation, but reacting when the background music swells or the room energy increases.
The visuals provide a kinetic wallpaper that responds to the vibe of the room without demanding direct attention from the patrons. Gallery installations demand precise synchronization and reliable, unattended operation.
An artist uses the application to present a collection of static digital artworks. An iPhone runs the application, connected to a dedicated audio playback device and a small, high-quality projector.
The artist sets up a playlist of experimental soundscapes. They load the digital artworks into the Image engine.
They use a strict mapping structure: specific frequency spikes trigger absolute image swaps, while sustained tones manipulate the color saturation of the current image. The hardware operates on wall power with screen sleep disabled, running continuously for the duration of the exhibition.
The tight coupling of the specific soundscape to the visual parameters creates a unified sensory experience for the gallery visitors. Background projections for live bands present a chaotic acoustic environment.
A rock band uses a Mac running the application, projecting onto a large screen behind the drum kit. Relying on an open microphone in this scenario is disastrous, as the sheer volume of the drum kit will overwhelm the input.
The sound engineer routes a dedicated auxiliary mix from the digital console into the Mac via USB. This mix contains only the kick drum, the snare drum, and the lead vocal.
The operator maps the kick drum to extreme scale bursts on the Image engine, the snare drum to rapid color inversion, and the vocal to image distortion parameters. This specific routing isolates the visual triggers, ensuring that the projections react precisely to the core rhythmic elements of the band, ignoring the wash of guitars and cymbals.
Performance Optimization and Thermal Management
Real-time audio analysis and visual rendering generate significant heat and drain batteries rapidly. Managing the hardware resources is essential to prevent frame rate drops, thermal throttling, and complete system failure during a performance.
Frame rate management is the primary concern. The application aims for a consistent sixty frames per second to ensure fluid visual motion.
When you load multiple high-resolution video files into the Video engine and apply complex audio mappings, the processing load spikes. If the hardware cannot maintain the calculation speed, the frame rate drops, resulting in stuttering, disconnected visuals that no longer synchronize with the audio.
To optimize the frame rate, always match your asset resolution to your output resolution. If you are projecting onto a 1080p screen, do not load 4K video loops.
The hardware wastes processing power downscaling the video every frame. Pre-render all video assets to 1080p before loading them into the application.
If you use the Image engine, resize large photographs to match the target display. 264 or HEVC reduces the decoding burden on the processor.
Thermal management dictates the longevity of the performance. Mobile devices, particularly iPhones and iPads, rely on passive cooling.
When the processor runs at maximum capacity for extended periods, the device generates immense heat. To protect the internal components, the operating system initiates thermal throttling, intentionally slowing down the processor.
This immediately destroys the frame rate and introduces severe latency into the audio-visual synchronization.
- Keep the device cool. Never place the iPhone or iPad in direct sunlight or near hot stage lighting. If operating in a hot venue, use a stand that exposes the back of the device to ambient air. Avoid restrictive cases that trap heat against the chassis.
- Manage background processes. Close all other applications on the host device. Disable Wi-Fi and Bluetooth if you are not actively using them for control. Put the device in Airplane mode to prevent incoming calls or notifications from interrupting the rendering engine or demanding processor cycles.
- Screen sleep override. The operating system will attempt to sleep the screen to save battery. You must disable this feature in the system settings, or the visual output will vanish mid-performance. Ensure the display auto-lock is set to 'Never'.
Power delivery requires absolute certainty. Visualizer Mode consumes battery power aggressively.
You cannot rely on internal batteries for a performance lasting more than an hour. You must supply continuous wall power to the host device.
When using an iPhone or iPad, use a high-capacity USB-C hub that provides pass-through power delivery while simultaneously outputting the HDMI signal and accepting the USB audio interface. Verify that the power adapter supplies sufficient wattage to run the device and charge the battery under heavy load.
A weak charger will result in a slow battery drain, eventually leading to system shutdown despite being plugged into the wall.
| Issue | Primary Cause | Immediate Solution |
|---|---|---|
| Frame Rate Drops | Asset resolution too high, excessive processing load | Downscale video files to 1080p, switch to Image engine |
| Thermal Throttling | Poor ventilation, extended high-load operation | Remove device case, place in airflow, reduce output resolution |
| Battery Drain while plugged in | Insufficient wattage from power adapter or hub | Use high-wattage power supply (60W+), verify hub specs |
Where to get free visual tools
Testing audio-reactive concepts before committing to a full hardware setup allows you to refine your signal routing and mapping strategies. We provide a suite of browser-based tools that utilize your computer's microphone and processing power to generate immediate visual output.
The primary testing environment is available at /visualizer. This web application runs directly in your browser without installation.
It captures audio from your default microphone and renders reactive scenes using WebGL. You can test different frequency band reactions, adjust sensitivity, and cycle through presets like Pulse and Dither to understand how audio signals translate to visual motion.
Accurate audio mapping requires an understanding of your track's tempo and structure. Use the tool at /tools/bpm-finder to calculate the precise beats per minute of your audio files.
Tap the spacebar in time with the music to generate an accurate tempo reading, which assists in setting manual visual rhythms if you choose not to rely entirely on audio analysis. If you plan to incorporate external hardware controllers into your setup alongside the audio analysis, verify your MIDI routing using the utility at /tools/midi-tester.
This tool displays raw incoming MIDI data, confirming that your knobs, faders, and pads are sending the correct control change messages to the browser, preparing you for complex hardware integration. To begin building your asset library for the Video engine, download our curated collection of royalty-free, optimized video loops at /loops.
These files are pre-rendered at appropriate resolutions and encoded for efficient playback, providing a stable baseline for testing your audio mappings and parameter assignments.
What to do next
Executing a successful audio-reactive performance requires methodical preparation. Follow these exact steps to move from initial testing to a live, stable visual output.
- Define the signal path. Decide how the audio reaches your device. If using a Mac or iPad, acquire a class-compliant USB audio interface and the necessary cables to route a dedicated mix from the sound console. If using an iPhone, test the internal microphone in the actual venue to determine the clipping point.
- Prepare the asset library. Gather the images or video loops you intend to use. Resize all static images to match your output resolution. Downscale and encode all video loops to 1080p using H.264 to guarantee optimal playback performance and prevent frame drops.
- Establish the hardware baseline. Connect the device to wall power using a high-capacity hub. Connect the external display via HDMI. Disable screen sleep and all background applications. Confirm that the hardware charges while running the application and outputting video.
- Calibrate the audio input. Play the intended audio source at performance volume. Adjust the hardware gain to prevent clipping. Set the noise gate to eliminate ambient room noise, ensuring the visuals return to a static resting state when the music stops.
- Execute the mapping strategy. Select the Image or Video engine. Assign the bass, mid, and high frequency bands to specific visual parameters. Adjust the sensitivity and scaling curves to dictate how aggressively the visuals respond to the volume peaks and frequency transients of the audio signal.
The system now monitors the acoustic environment and renders the visual output entirely based on the parameters you established. The audio dictates the motion.
You control the boundaries.